How CFILytics® measures culture.
Seven domains. Two poles each. One fixed calculation. This page shows what people answer, what we calculate and what you get to see.
Illustrative data. Two large gaps, two small ones. The band shows how far managers are apart among themselves.
Culture has three layers.
We measure the third.
Edgar Schein describes organisational culture in three layers. Most surveys stop at the first two.
Artefacts
What you see when you walk in. The office, the dress code, the tone of the all-hands. Visible, and easy to misread.
Espoused values
What the organisation says about itself. The values on the wall, the mission statement. Often sincere. Not always lived.
Basic underlying assumptions
What people take for granted about how work gets done here. Rarely spoken. Always acted on. This is the layer CFILytics® measures.
The model was developed with Sapience, a spin-off of the Vrije Universiteit Brussel, and is described in the book De Architectuur van Bedrijfscultuur (Pelgrims & Desmet, 2026).


One scale.
Seven domains.
Two poles each.
Every domain is a scale between two ways of working. Neither pole is better. A profile is a position on each of the seven scales.
Leadership
Autonomy ↔ Control
How much steering is wanted?
Communication
Direct ↔ Diplomatic
How honest may feedback be?
Collaboration
Individual ↔ Collective
Who gets the credit?
Innovation
Risk ↔ Stability
How do we handle change and risk?
Engagement
Intrinsic ↔ Extrinsic
Why do we get out of bed?
Work balance
Integration ↔ Segmentation
Where does work stop?
Inclusion & Sustainability
Pragmatic ↔ Values-driven
Are our values leading, or marketing?
No pole is better
Control is not worse than autonomy. Stability is not worse than risk. What matters is whether two profiles sit close together, or far apart.
An 8-minute chat with statements.
No test, no personality type. A conversation-style questionnaire that takes about eight minutes.
An invitation
Employees, managers or candidates receive a link. Anonymous or by name: you decide per campaign.
Statements, one at a time
Each statement describes a way of working and belongs to one domain. People say how much it applies, on a 7-point scale.
Two lenses
Employees describe the culture as it is today. Management also describes the culture it wants. Candidates describe how they prefer to work.
Something back
Every participant receives a personal insight report at the end. The measurement is not a one-way street.
Fixed. Deterministic. Nothing left out.
The same answers always give the same result. No model that learns, no weights that drift, no black box.
Answer becomes position
Every answer is a point between the two poles of its domain.
Answers become a profile
Per domain, the answers give a position on the scale. Seven positions make one profile: for a person, a team, a site, or management's desired culture.
Profiles become a distance
Two profiles are compared with Euclidean distance over all statements. All statements, all domains. Nothing is left out.
Distance becomes fit and gap
The distance gives one match percentage: the culture fit. Per domain it shows how far apart two profiles are: the culture gap, ranked from large to small.
Culture fit
How close a profile sits to another. A candidate to a team. A site to head office. Today's culture to the one management wants. One number, and the seven domains behind it.
Culture gap
Where the distance is largest. The gap tells you what a team is missing, what a merger will ask of both sides, or which domain to give extra weight when you hire. The other domains stay in the calculation.
From profile to report.
Real reports from the app, filled with demo data.
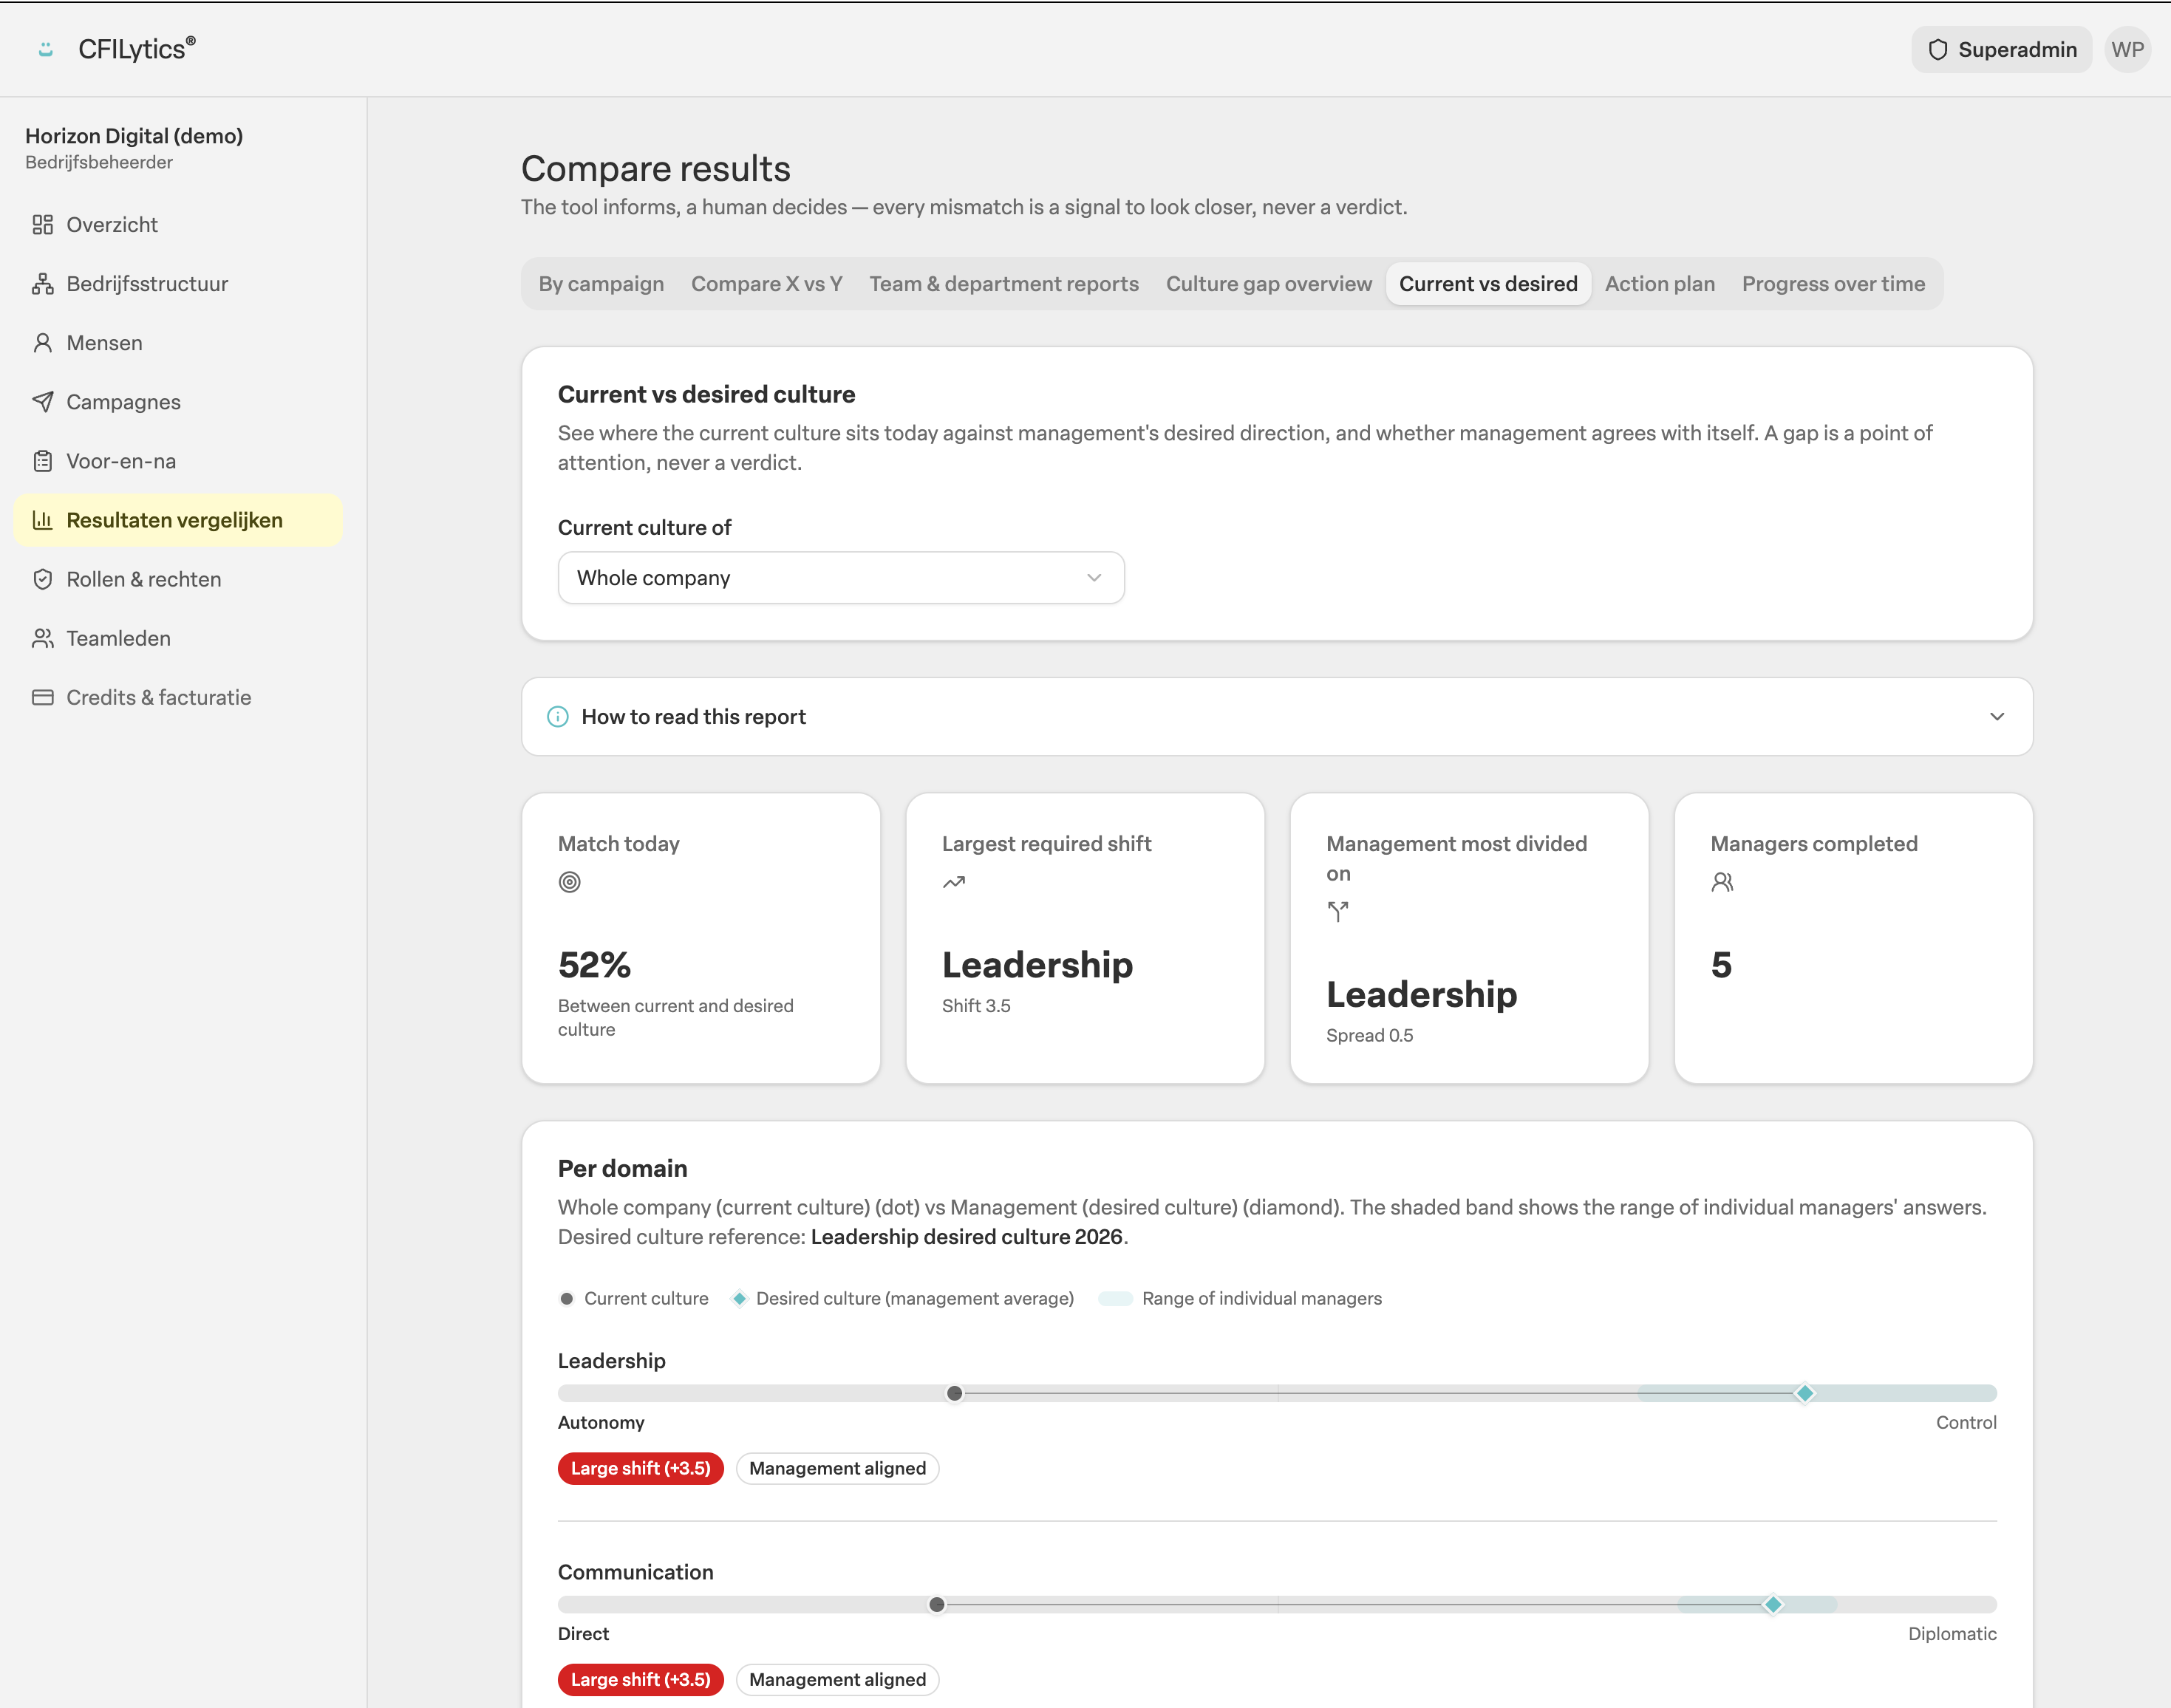
Two profiles on one scale.
Per domain: where the organisation sits today, where management wants it, and the distance between the two. The shaded band shows how far managers are apart among themselves.
Filter by location, department or team. Demo data from a fictional company.
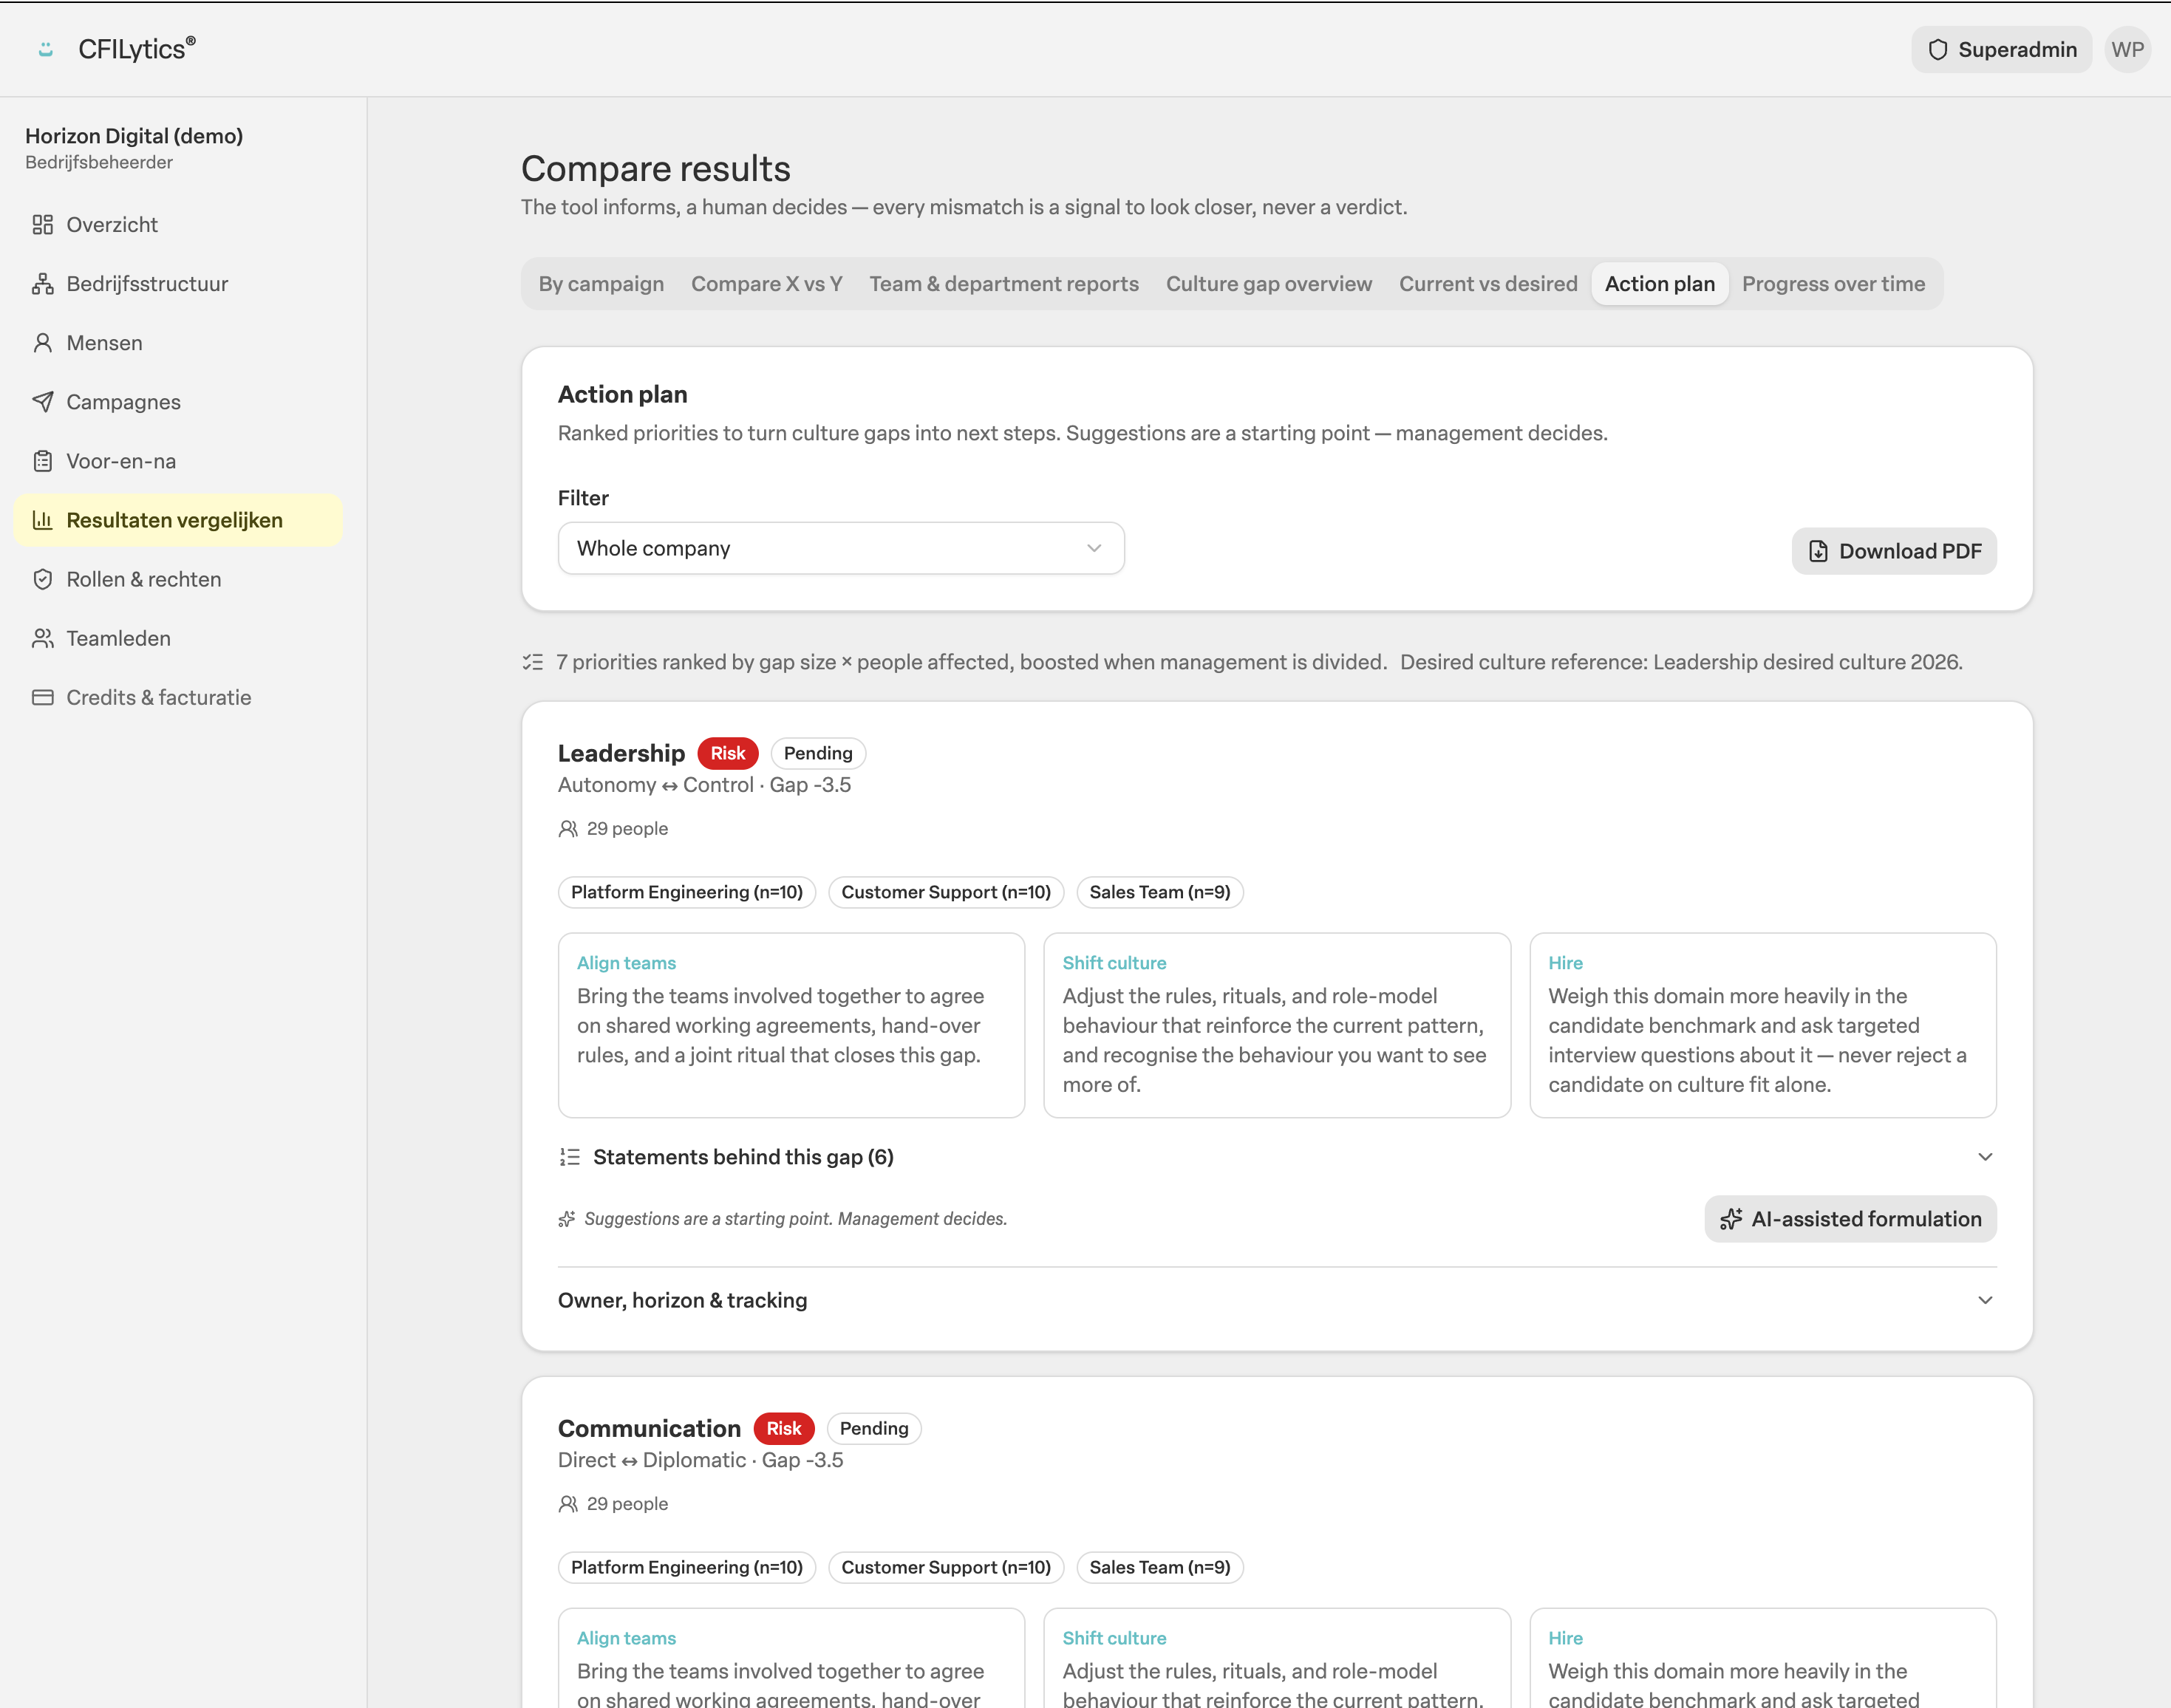
Gaps become priorities.
Every domain with a gap is ranked by the size of the gap and the number of people affected. For each priority you choose a route: align teams, shift the culture, or weigh it in hiring.
The tool informs. Management decides.
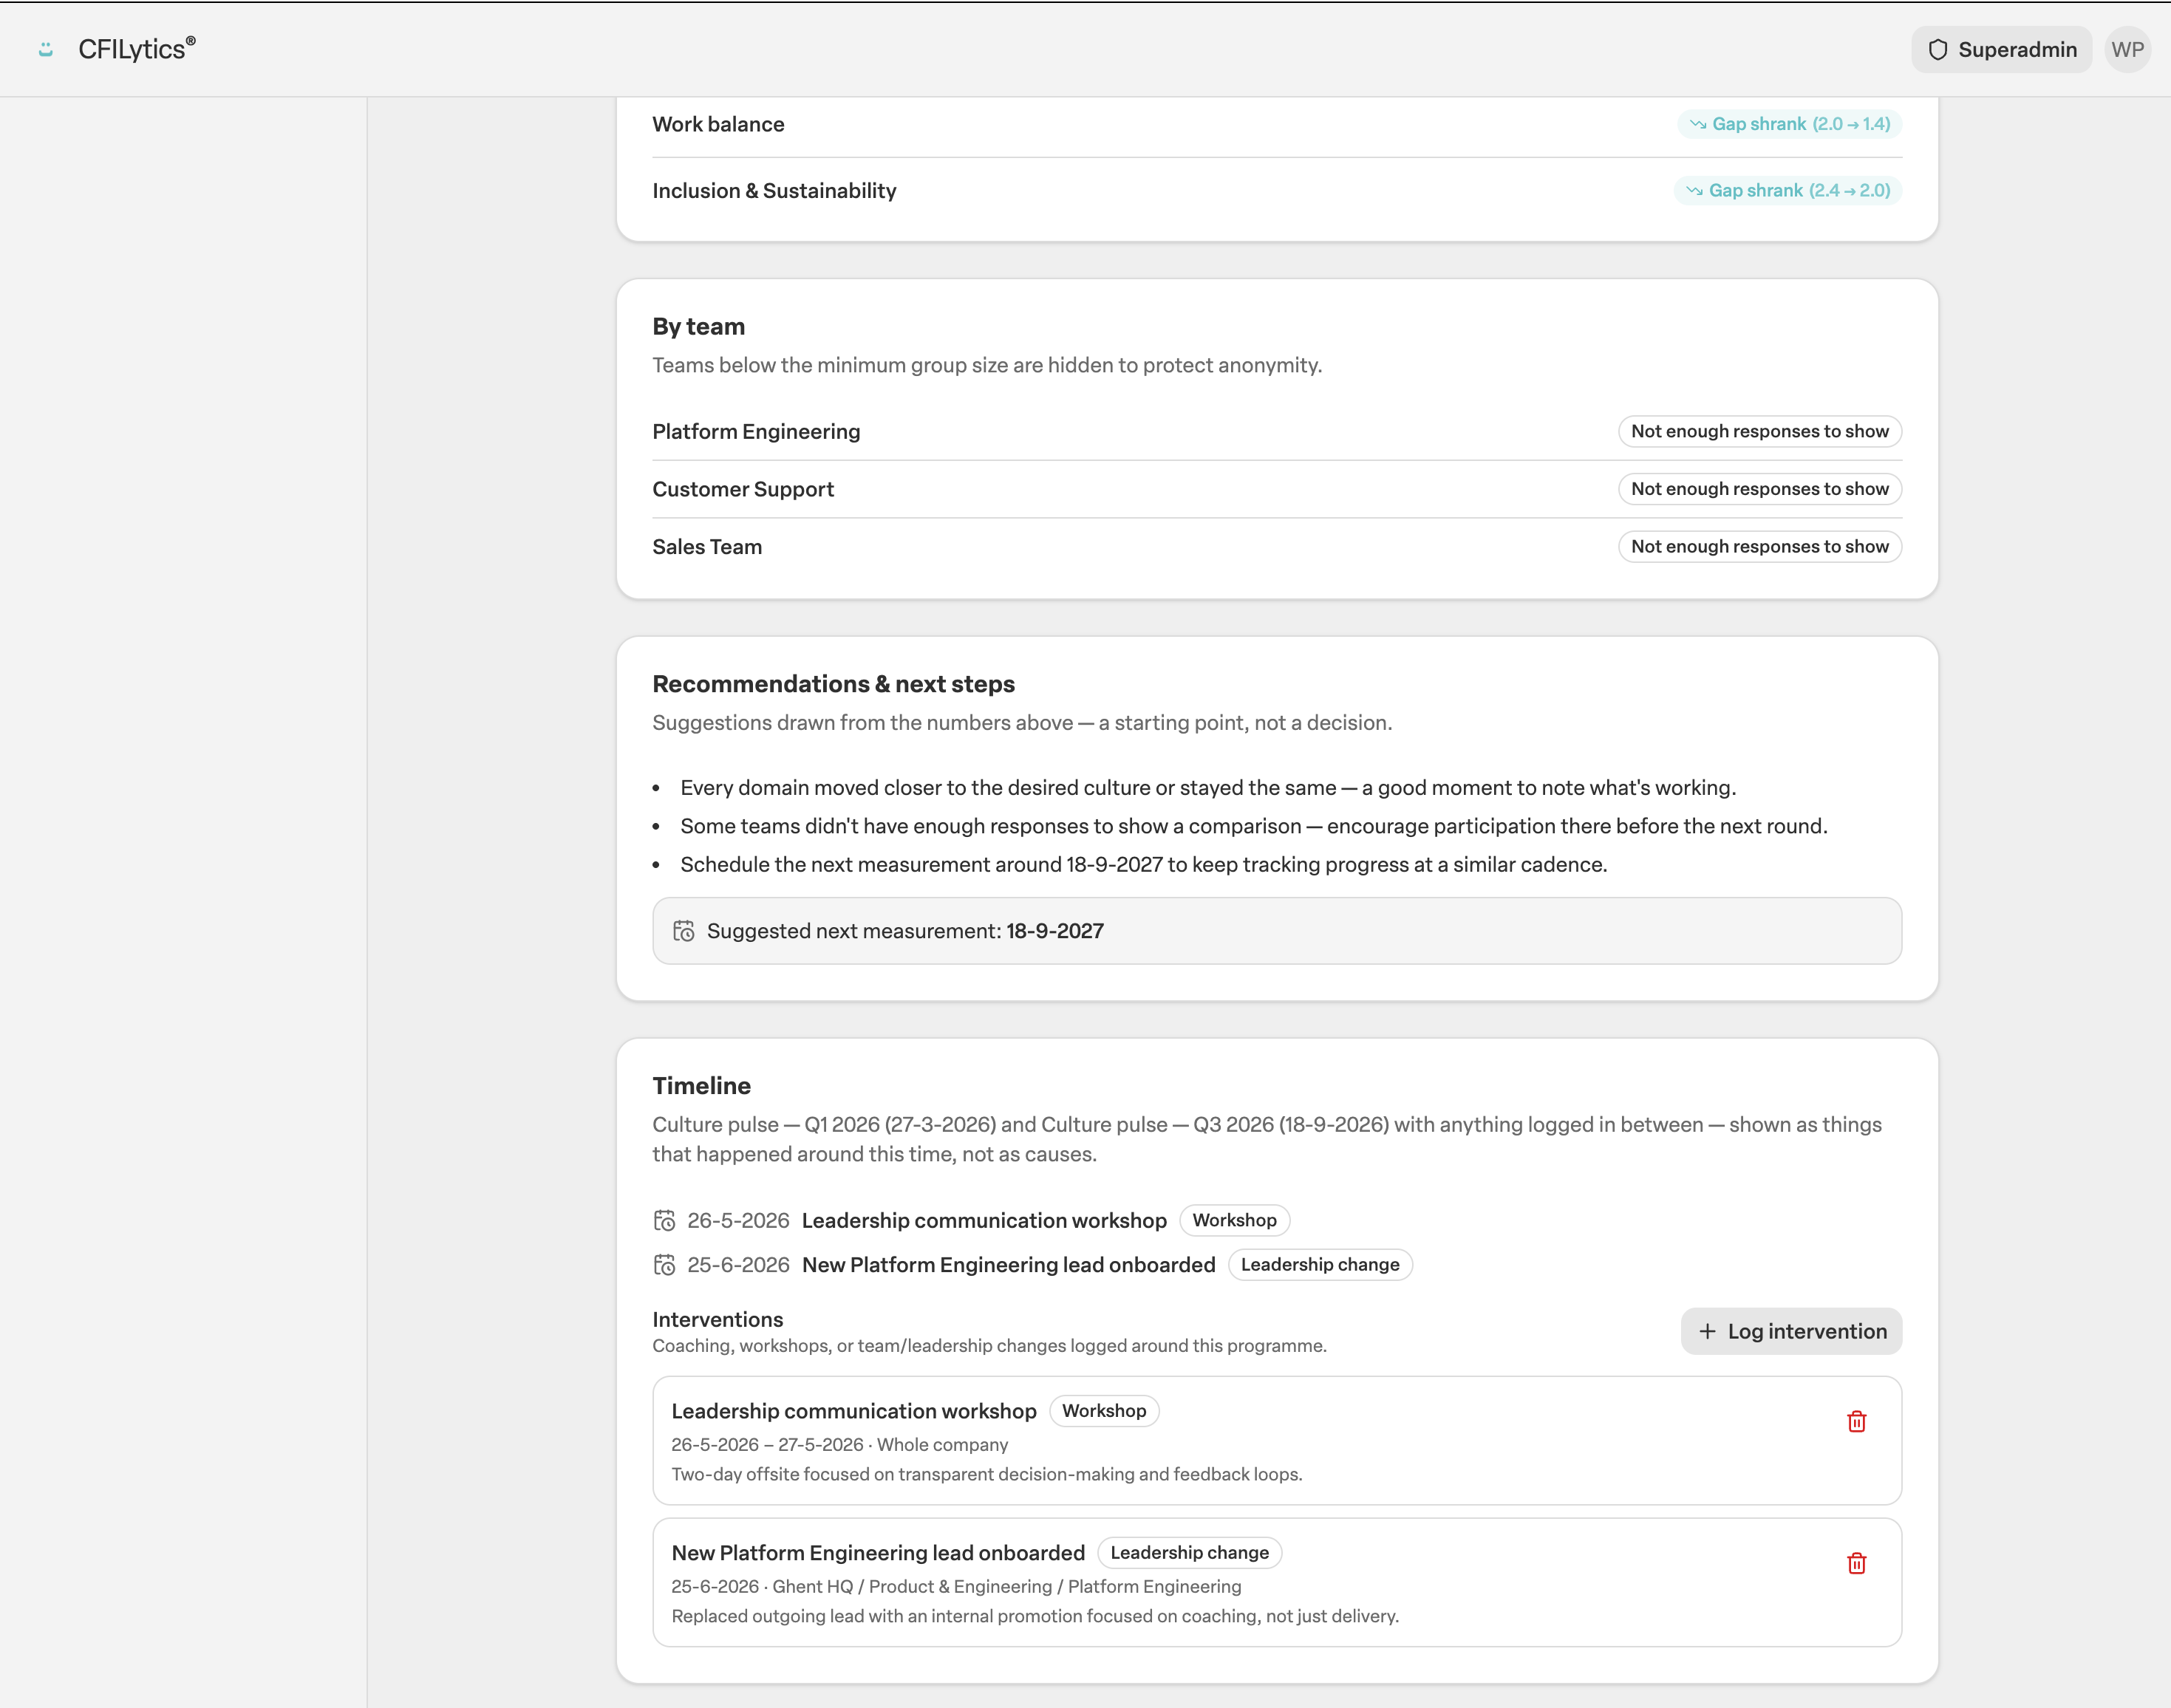
Measure again. See what moved.
Two measurements side by side, with the workshops, coaching and leadership changes you logged in between. Per domain you see whether the gap shrank, grew or stayed.
Shown as things that happened around the same time, not as proven causes.
A group is a profile too.
Teams, departments, locations and management each get their own profile, on the same scale. So differences between groups are real differences.
- Anonymous or by name, per campaign. For a culture measurement, anonymous is the default. For recruitment, candidates answer by name.
- Group results from 5 respondents. In an anonymous campaign a smaller group is shown at the next level up. Nobody can be singled out.
- Spread within management. The desired culture shows the average and how far managers are apart. A wide band is a finding in itself.
- Candidate data for 365 days. Then it is deleted. GDPR and EU AI Act.
Method, not magic.
A method you can explain to a board, a works council and a candidate. Model, calculation and scientific partner are on the table.
Based on Edgar Schein's basic underlying assumptions. Developed with Sapience, a spin-off of the Vrije Universiteit Brussel (VUB). Described in the book De Architectuur van Bedrijfscultuur (Pelgrims & Desmet, 2026).
- Deterministic scoring. The same answers always give the same result. No black box.
- Distance, not labels. Profiles are compared with Euclidean distance over all statements. Nothing is left out.
- Anonymous when you want it. You choose per campaign. Anonymous group results appear from 5 respondents.
- No automated decisions. The tool informs. A person decides.
- GDPR and EU AI Act. Candidate data is kept for 365 days.
What CFILytics® does not do.
It is not a personality test
It measures how people prefer to work and how an organisation works. Not who someone is. There are no types and no colours.
It gives no verdict
A large gap is a risk signal, never a conclusion. A candidate is never rejected by the tool. A person reads the report and decides.
It does not predict performance
It shows distance between profiles. What that distance means for your team, your deal or your hire is a judgement you make, with the report in hand.
Before you start.
Is it validated?
Can I see the statements beforehand?
Can people game the answers?
What about small teams?
Does the calculation change over time?
See the method on your own data.
Your first 10 measurements are free. Enough for one team, or your management.